Statistics
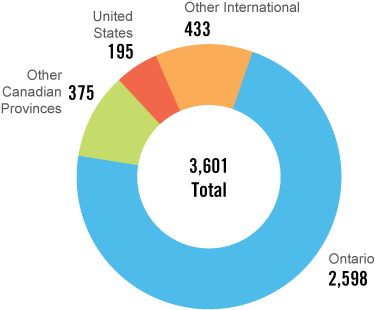
Applications for Membership
Application Results
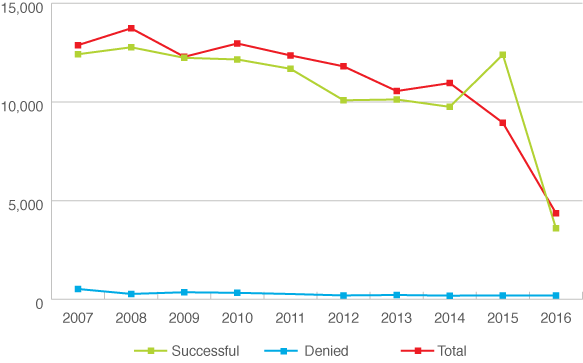
The reduction of successful applications in 2016 was due to the Enhanced Program because students have yet to graduate from the new program.
Total Number of Successful Applications for Membership
The reduction of successful applications in 2016 was due to the Enhanced Program because students have yet to graduate from the new program.
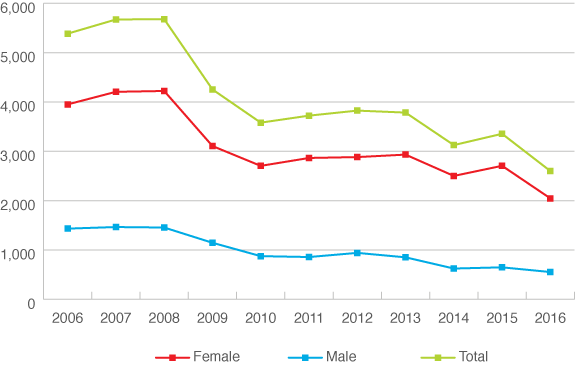
Total Number of New Teacher Induction Program Completions Annually
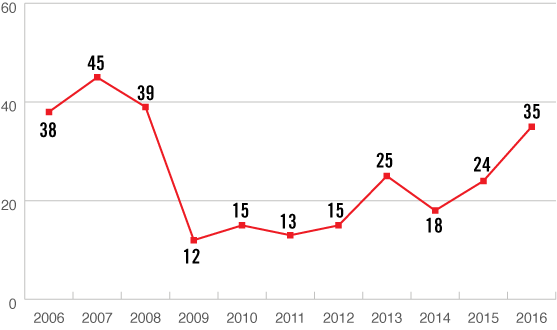
Total Number of Registration Appeal Decisions Rendered Annually