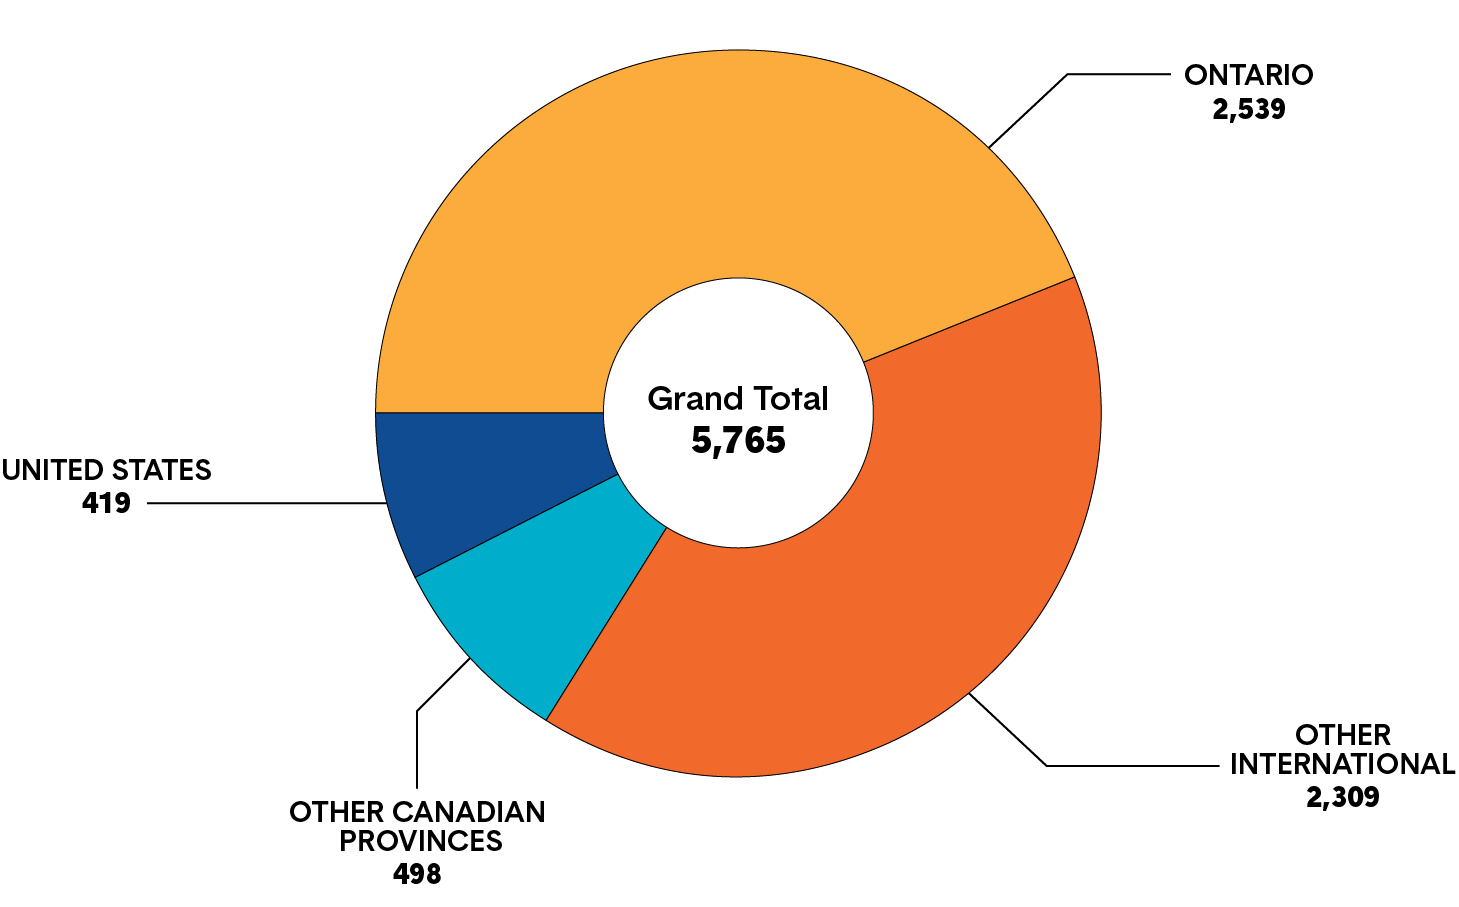
Applications for Membership
Total Number of Applicants Currently within the Registration Process (Active and Inactive)
Application Results

Note: in any given year, the number of successful applications and the number of denied applications do not necessarily correlate to the total applications for that year. "Total applications" indicates how many applications were initiated in any given year. Successful applications and denied applications could have been initiated in years previous to the year in which they were successful or denied.
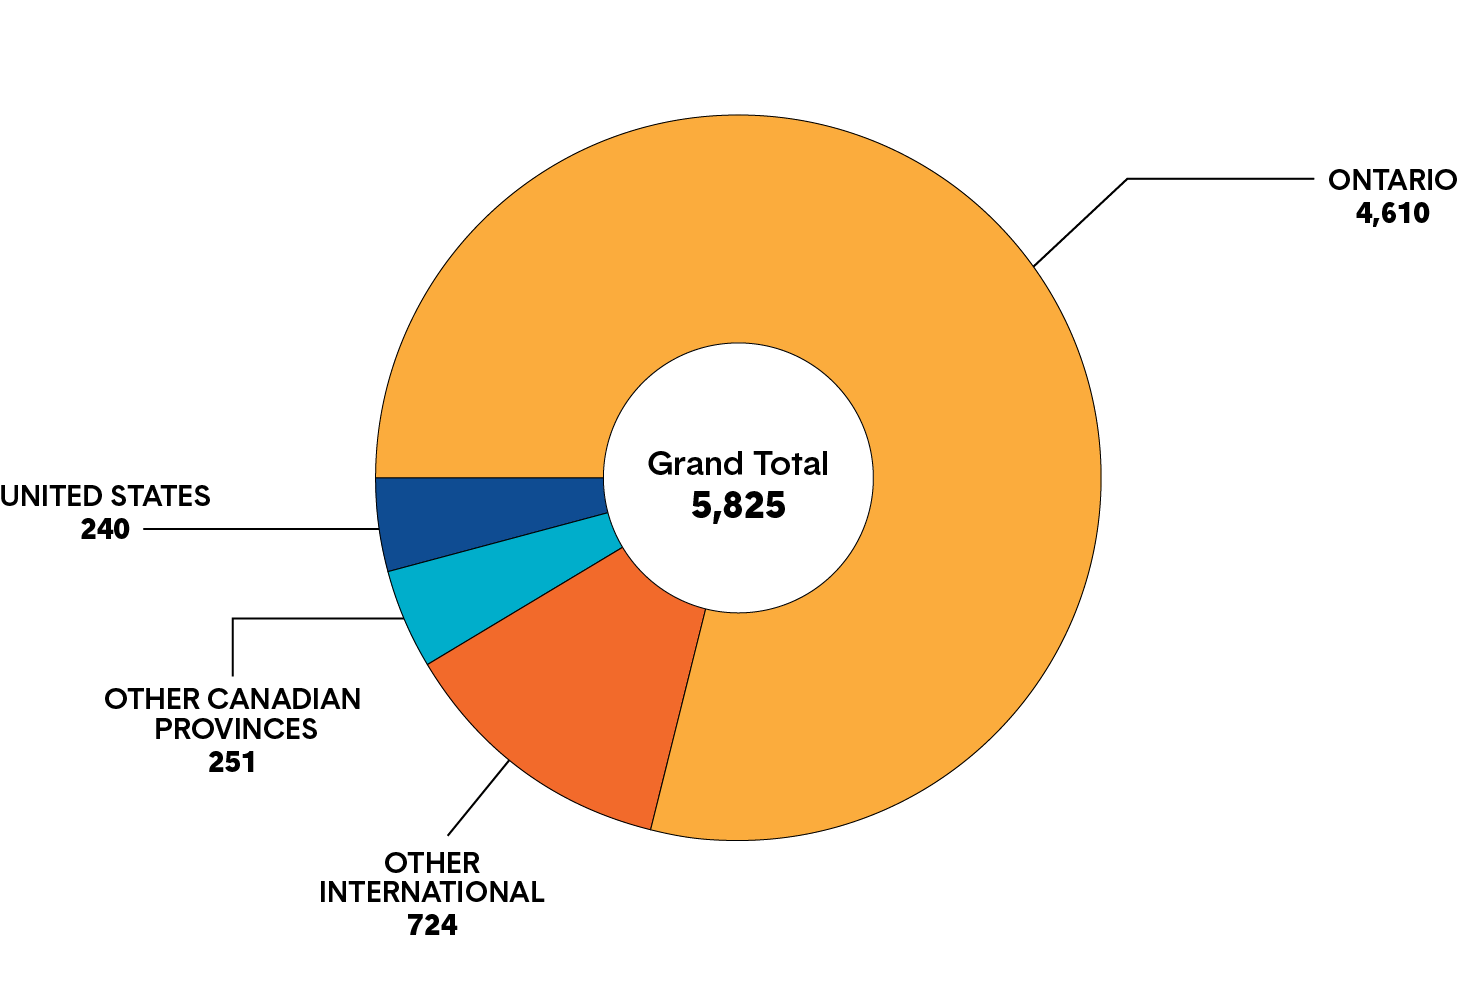
Total Number of Successful Applications for Membership
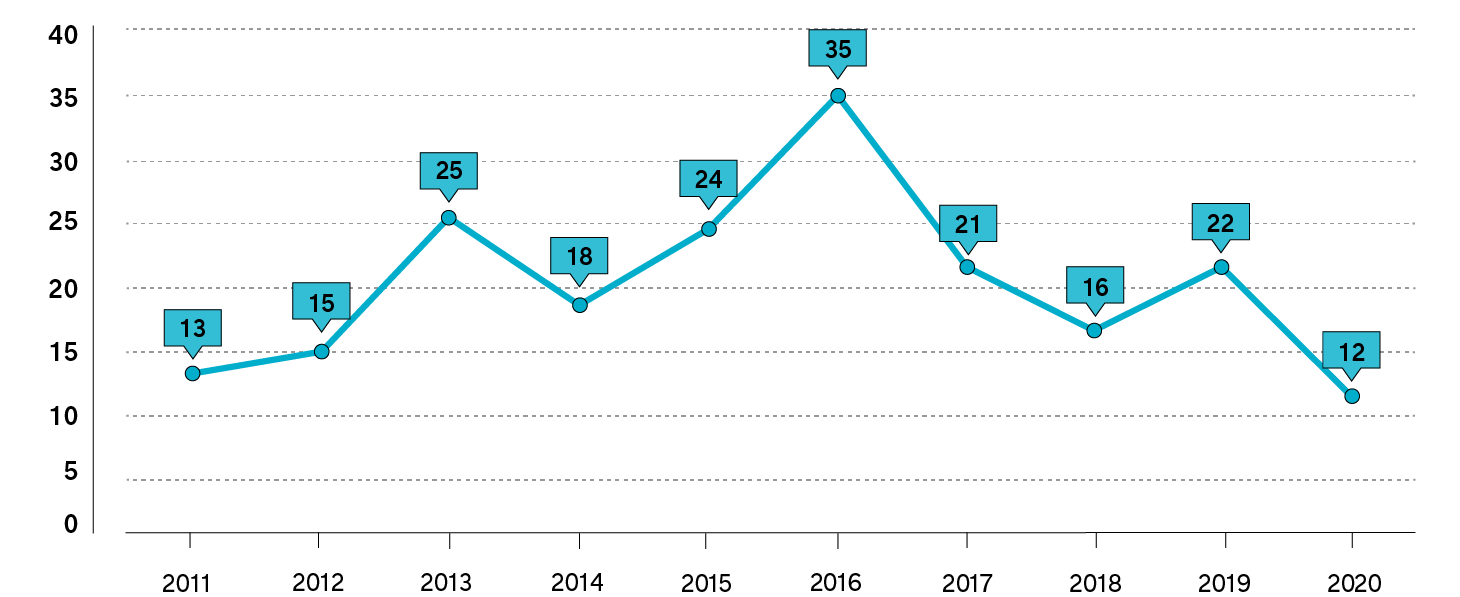
Total Number of New Teacher Induction Program Completions Annually

"X" is a third gender identifier for use by people identifying at Trans, Non-Binary, Two Spirited or Binary as well as anyone who chooses not to display their gender identity.
As a result of the physical closure of schools from March – June, 2020, many new teachers did not receive the second of the two Teacher Performance Appraisals required to complete the New Teacher Induction Program (NTIP). These teachers will continue in NTIP for the 2020-21 school year.