Transition to Teaching
Better times are ahead for new Ontario teachers. After years of ever worsening jobs reports from early-career teachers, unemployment rates dropped for new education graduates surveyed in 2014.
Today’s job queues are still lengthy. Many underemployed teachers augment their incomes with non-teaching work for years before they can settle into full-time teaching careers. But fewer new Ontario teachers in 2013 and 2014 meant more supply days for first-year teachers. And sharply reduced numbers of education graduates after 2015 will allow many of them to progress much faster to long-term occasional and permanent teaching jobs.
The College’s Transition to Teaching survey looks at the early careers of new Ontario teachers. This Ministry of Education-funded annual study began in 2001. At that time, Ontario was in the midst of a retirement-driven teacher shortage that started in 1998 and lasted about five years. A teacher surplus began to emerge by 2005 and grew rapidly in the years that followed as newly licensed teachers greatly outpaced teacher retirements year after year.
The early signs that the tide is turning are clear in the 2014 survey results. Reduced education graduate numbers over the past two years, a rapid decline in out-of-province applicants for Ontario teaching licences, and the teacher education reforms of 2015 mean the job market in the years ahead will be far more welcoming than the over-crowded scene that confronted new teachers over the past decade.
The Transition to Teaching 2014 study of new teachers, in the 2013–14 school year, examines:
- the job-entry success and professional experience of teacher education graduates of 2004 through 2013 and
- new-to-Ontario teachers educated elsewhere and certified in 2012 and 2013.
What was it like to be a new teacher in 2014? Read our exclusive survey to find out.


First-year teacher job outcomes in Ontario and outside Ontario

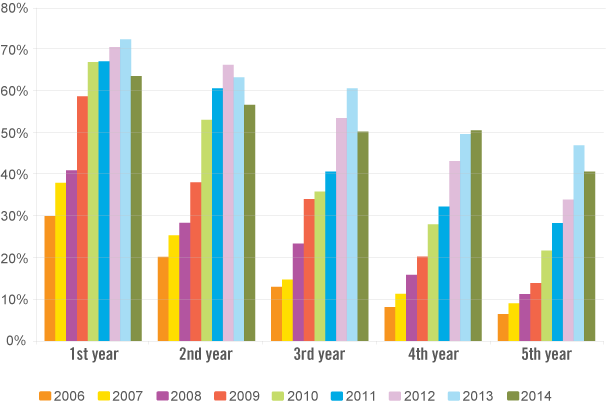
Underemployed and unemployed by year of teaching career: 2006 to 2014 surveys
First-year teachers with regular teaching jobs by year of graduation and language

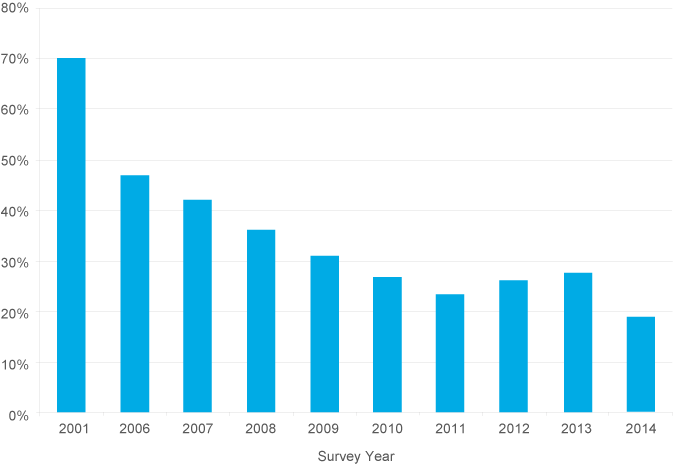
Percentage of first-year teachers with regular teaching jobs
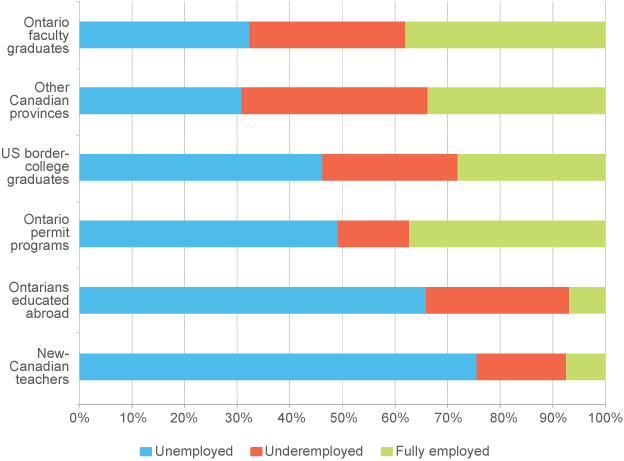
Employment outcomes for different first year new-teacher groups