Statistics

Transition to Teaching


Unemployment Rates for Early-Career Teachers

Unemployment Rates for Early-Career Teachers

Early-Career Teachers with Permanent Contracts

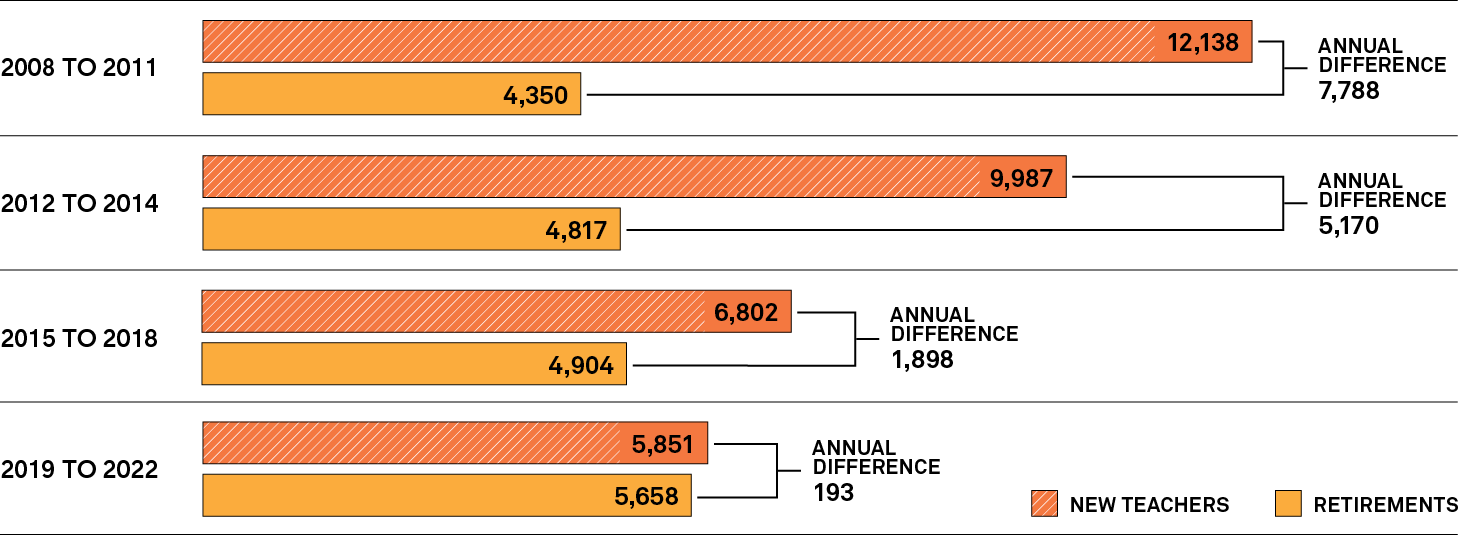
Teacher Shortages Mean More Jobs for New Graduates

The College’s latest Transition to Teaching survey found unemployment for early-career teachers continues to recede. With an insufficient number of future Ontario teachers on track to start their teaching careers, this shortage will challenge school boards for the next several years.

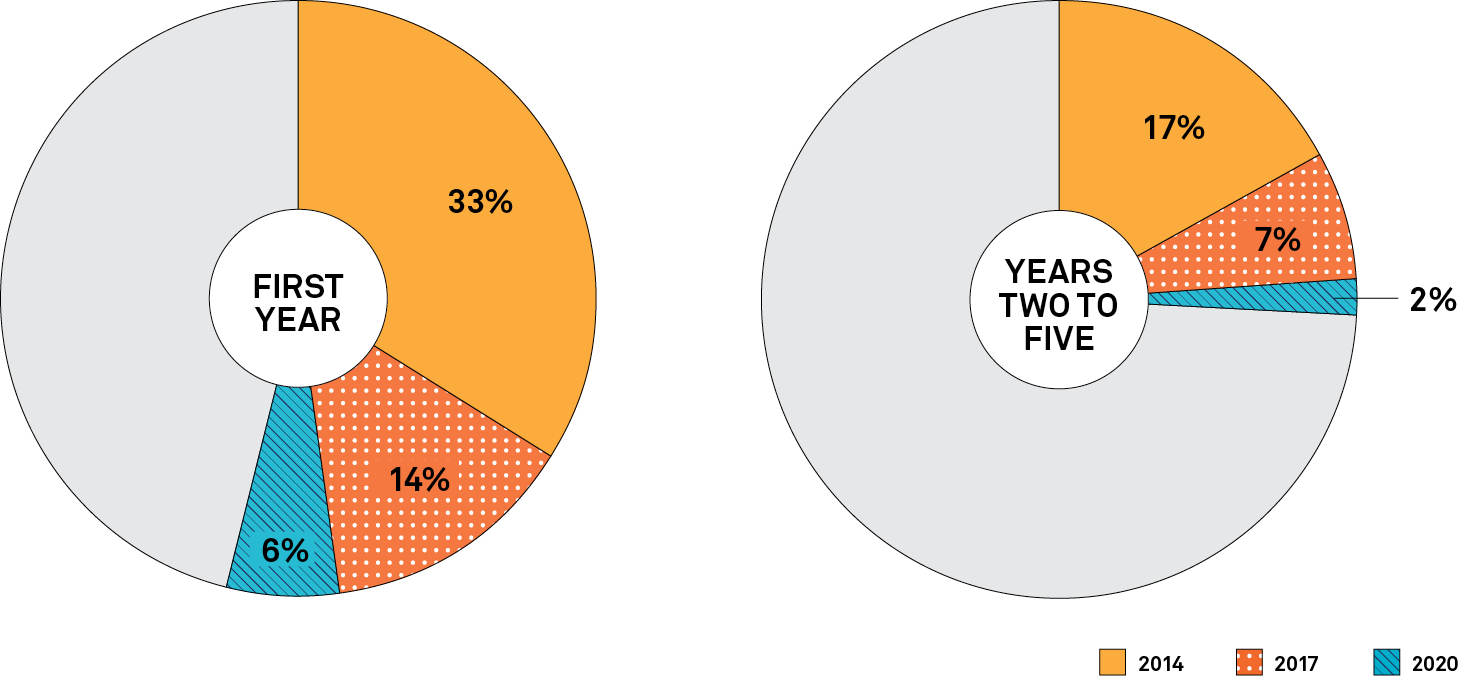
Recent education graduates in Ontario reported less unemployment in the 2019–20 school year than in years past. The latest survey found first-year Ontario graduate unemployment at six per cent, with an average rate for teachers in years two through five between two and three per cent. These reports are much lower than the double-digit unemployment rates of recent years.

Despite the positive labour market for Ontario's early-career teachers in 2019–20, the journey was not easy for those trying to progress from part-time to full-time teaching jobs.

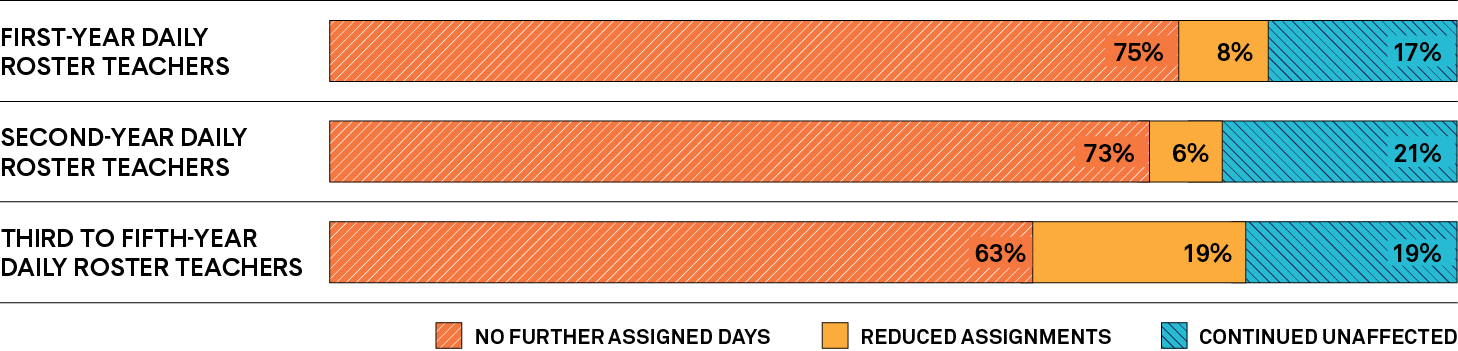
School closures in March 2020 ended all further teaching assignments for many daily occasional roster teachers and cut into weekly teaching days for others. Many first-year teachers say they did not teach as much as they wanted to during the school year. This underemployment rate jumped to 34 per cent in 2020 from just 14 per cent the previous year. Reports of job interview and appointment delays after schools closed added to the COVID-19 fallout that hit some newly licensed Ontario teachers.

Meanwhile, collective agreements with the province's teacher federations resolved future uncertainties with respect to average class size funding for Ontario district school boards. Proposals to increase student/teacher class sizes in secondary schools from 22/1 to as high as 28/1 are no longer on the table. Nonetheless, averages did rise to 23/1 in 2019–20 from 22/1 the previous year, restricting job opportunities for secondary panel teachers.

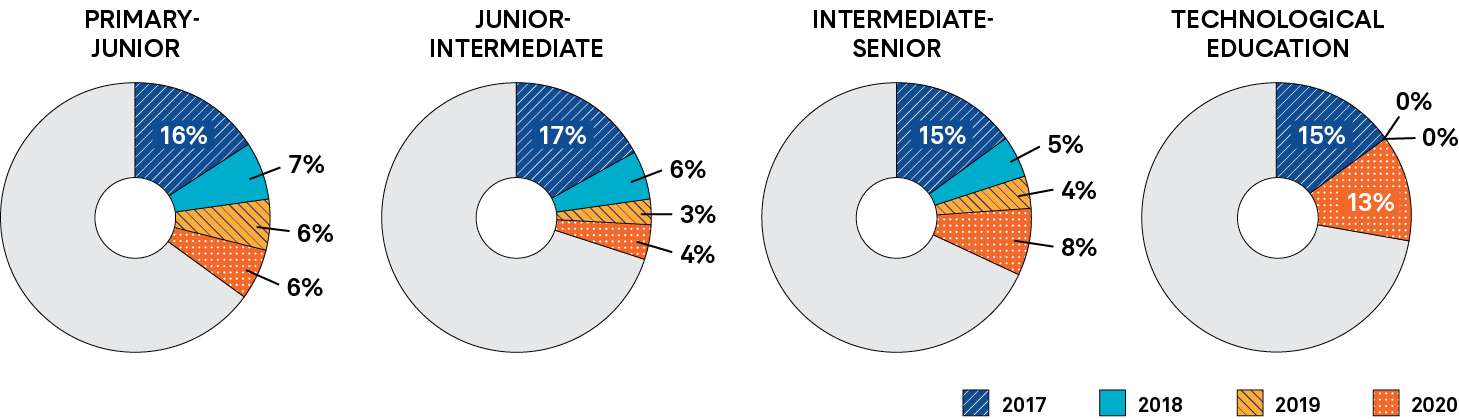
The combined effects of school closures, which delayed some teacher hiring, and secondary class size increases can be seen in the differences in the unemployment rate across certification divisions among first-year teachers.

Read the full 2020 Transition to Teaching survey, here.

Unemployment Rates for Early-Career Teachers

Two pie charts depict the percentage of unemployed first year teachers and unemployed teachers in years two to five of their careers, in 2014, 2017 and 2020. Long description follows. 

First Year

  • 33% in 2014
  • 14% in 2017
  • 6% in 2020

Years Two to Five

  • 17% in 2014
  • 7% in 2017
  • 2% in 2020

Annual New and Annual Retiring Teachers

A bar graph depicts the numbers of annual new and annual retiring teachers from 2008 to 2011, 2012 to 2014 and 2015 to 2018 and forecasts the figures for 2019 to 2022. Long description follows. 

2008 to 2011

  • 12,138 new teachers
  • 4,350 retirements
  • 7,788 annual difference

2012 to 2014

  • 9,987 new teachers
  • 4,817 retirements
  • 5,170 annual difference

2015 to 2018

  • 6,802 new teachers
  • 4,904 retirements
  • 1,898 annual difference

2019 to 2022

  • 5,851 new teachers
  • 5,658 retirements
  • 193 annual difference

Early-Career Teachers with Permanent Contracts

A bar graph shows the percentages of early-career teachers with permanent contracts in French-language District Boards, who are FSL-qualified and working in English District Boards, and who are English-language teachers working in English District Boards. Long description follows. 

French-language District Board

  • 53% Year 1
  • 78% Year 3
  • 86% Year 5

FSL-qualified teachers in English District Board

  • 29% Year 1
  • 64% Year 3
  • 84% Year 5

English-language teachers, English District Board

  • 5% Year 1
  • 25% Year 3
  • 43% Year 5

Unemployment Rate for First-Year Teachers

Four pie charts depict unemployment rates for first-year teachers who work with primary-junior grades, junior-intermediate grades and intermediate-senior grades, and who work in technological education. Long description follows. 

Primary-Junior

  • 16% in 2017
  • 7% in 2018
  • 6% in 2019
  • 6% in 2020

Junior-Intermediate

  • 17% in 2017
  • 6% in 2018
  • 3% in 2019
  • 4% in 2020

Intermediate-Senior

  • 15% in 2017
  • 5% in 2018
  • 4% in 2019
  • 8% in 2020

Technological Education

  • 15% in 2017
  • 0% in 2018
  • 0% in 2019
  • 13% in 2020

Early-Career Daily Roster Teachers Affected by COVID-19 School Closures in March 2020

A bar graph shows the percentages of first-year daily roster teachers, second-year daily roster teachers and third- to fifth-year daily roster teachers who either continued work unaffected, had reduced assignments or had no further assigned days after COVID-19 school closures in March, 2020. Long description follows.  

First-year daily roster teachers

  • 75% - no further assigned days
  • 8% - reduced assignments
  • 17% - continued unaffected

Second-year daily roster teachers

First-year daily roster teachers

  • 73% - no further assigned days
  • 6% - reduced assignments
  • 21% - continued unaffected

Third- to fifth-year daily roster teachers

  • 63% - no further assigned days
  • 19% - reduced assignments
  • 19% - continued unaffected

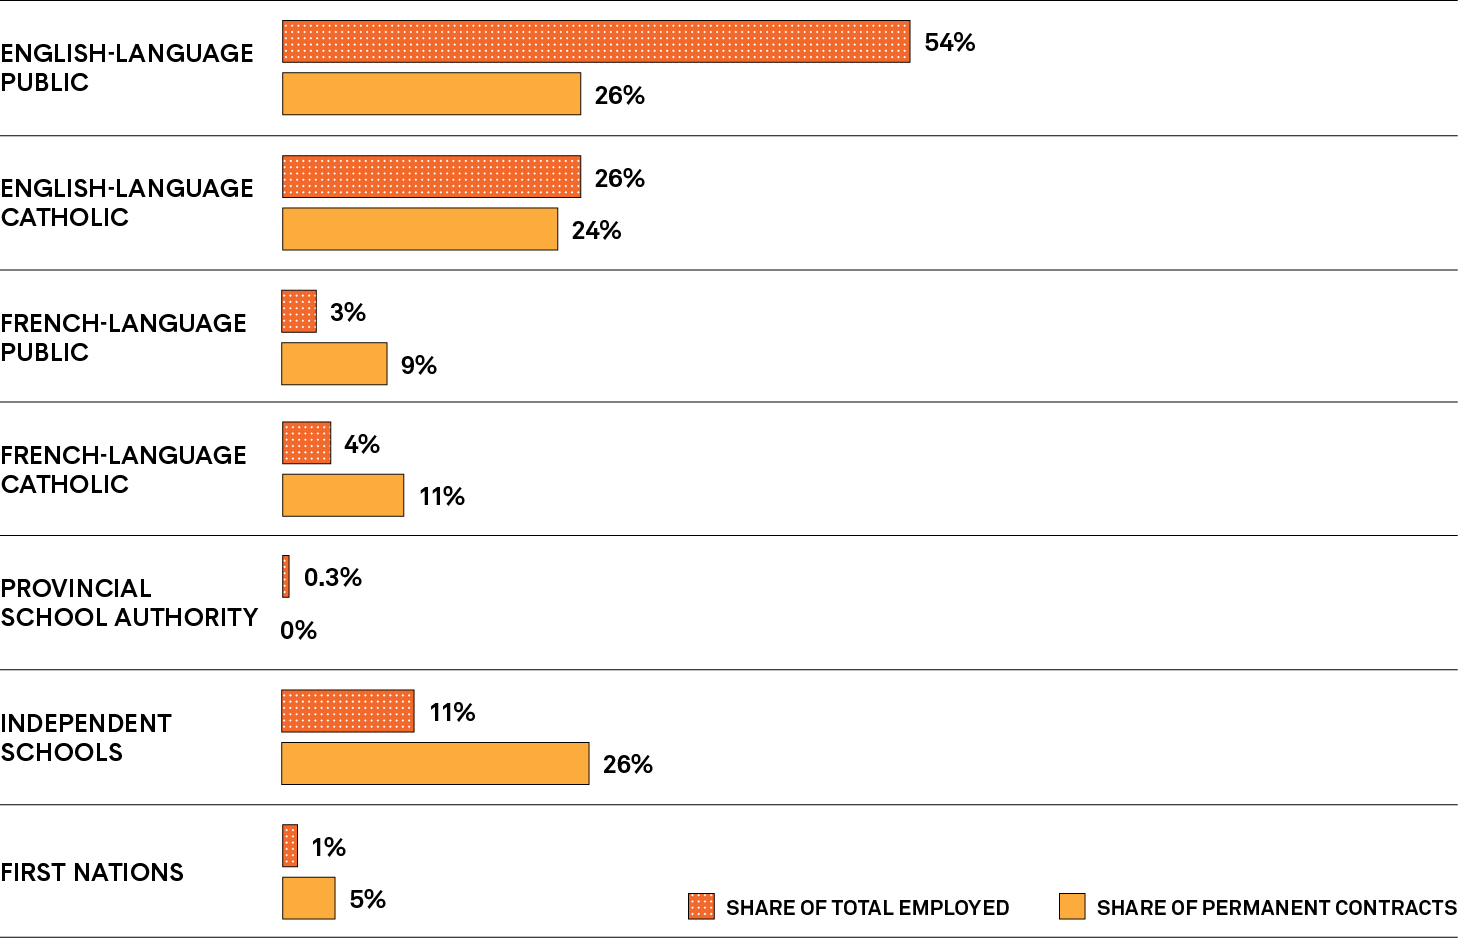
Employers of First-Year Teacher Hires

A bar graph shows the percentages of first-year teacher employers that were English-language public boards, English-language Catholic boards, French-language public boards, French-language Catholic boards, provincial school authorities, Independent schools and First Nations schools. Long description follows. 

English-language public

  • 54% - share of total employed
  • 26% - share of permanent contracts

French-language public

  • 3% - share of total employed
  • 9% - share of permanent contracts

French-language Catholic

  • 4% - share of total employed
  • 11% - share of permanent contracts

Provincial school authority

  • 0.3% - share of total employed
  • 0% - share of permanent contracts

Independent Schools

  • 11% - share of total employed
  • 26% - share of permanent contracts

First Nations

  • 1% - share of total employed
  • 5% - share of permanent contracts

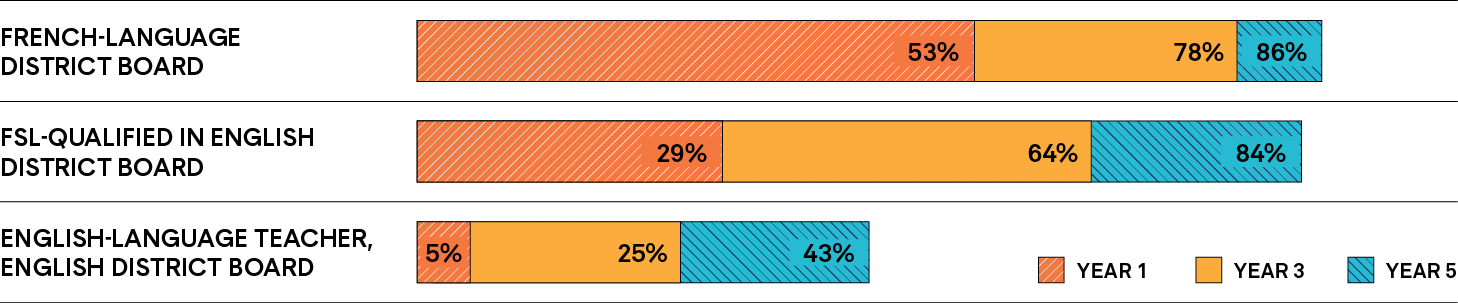
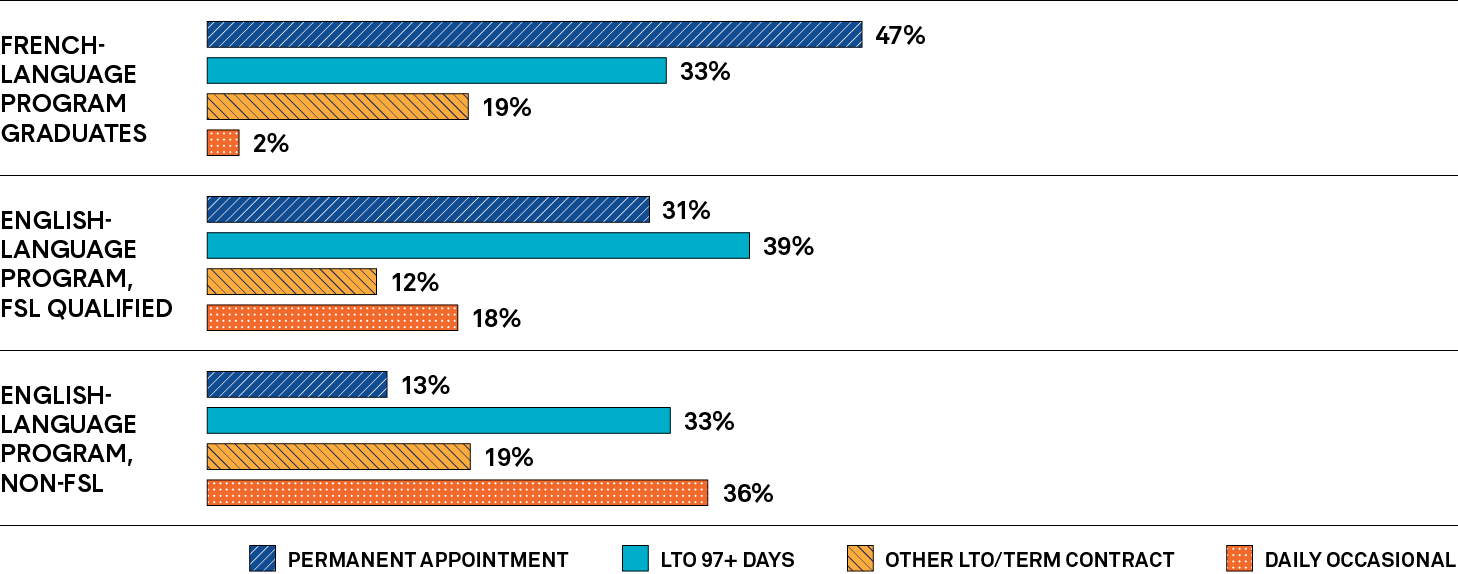
First-Year Teacher Contracts in 2020 by Language of Teacher Education

A bar graph shows the percentages of teachers who are French-language program graduates, FSL-qualified English-language program graduates, or non-FLS English-language program graduates with permanent appointments, LTO assignments for longer than 97 days, other LTO/term contracts or daily occasional work. Long description follows. 

French-language program graduates

  • 47% - permanent appointment
  • 33% - LTO 97+ days
  • 19% - other LTO/term contract
  • 2% - daily occasional

English-language program, FSL qualified

  • 31% - permanent appointment
  • 39% - LTO 97+ days
  • 12% - other LTO/term contract
  • 18% - daily occasional

English-language program, non-FSL qualified

  • 13% - permanent appointment
  • 33% - LTO 97+ days
  • 19% - other LTO/term contract
  • 36% - daily occasional

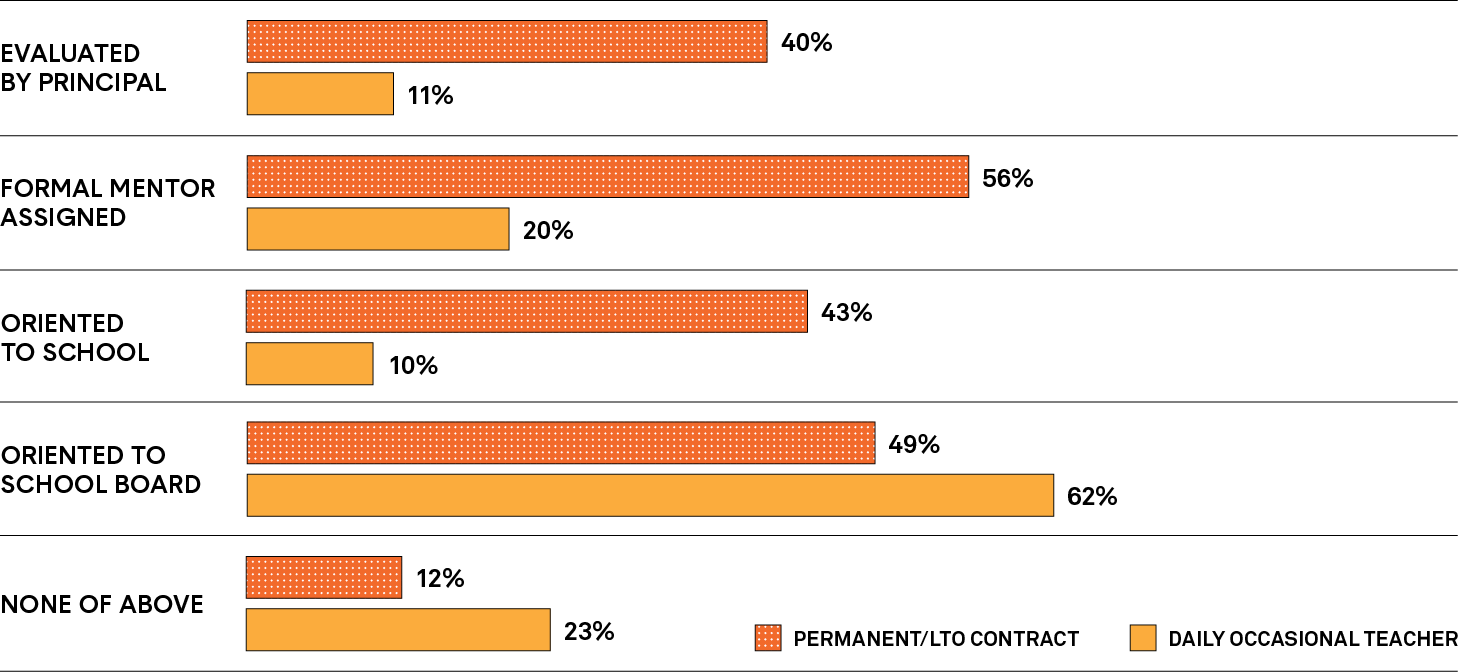
Daily Occasional Teacher In-School Support Gap

A bar graph illustrates the percentages of permanent/LTO contract and daily occasional teachers who were evaluated by a principal, had a formal mentor assigned, were oriented to a school, were oriented to a school board or experienced none of these support measures. Long description follows. 

Evaluated by a principal

  • 40% - permanent/LTO contract
  • 11% - daily occasional teacher

Formal mentor assigned

  • 56% - permanent/LTO contract
  • 20% - daily occasional teacher

Oriented to school

  • 43% - permanent/LTO contract
  • 10% - daily occasional teacher

Oriented to school board

  • 49% - permanent/LTO contract
  • 62% - daily occasional teacher

None of the above

  • 12% - permanent/LTO contract
  • 23% - daily occasional teacher